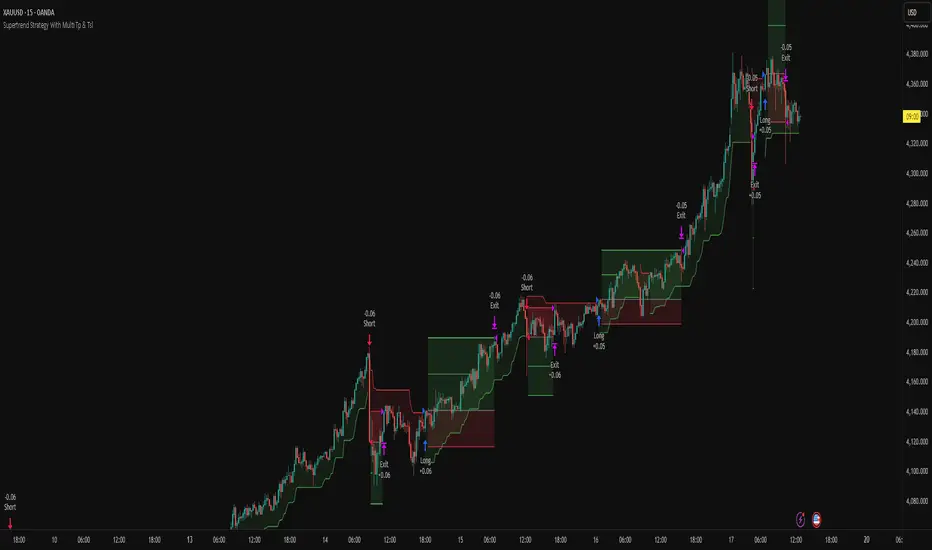
Supertrend Strategy With Multi Tp & TslHello Traders,
This strategy is based on the popular Supertrend indicator, which many traders use as a simple trend-following tool. The core entry logic is straightforward:
Buy (Long) when the price closes above the Supertrend line.
Sell (Short) when the price closes below the Supertrend line.
However, trading success isn’t only about entries — proper risk management makes all the difference. That’s why this strategy includes four stop-loss methods, two take-profit types, and a trailing stop-loss system. You can customize all of these settings to create your own personalized version.
🛑 Stop-Loss Methods
Tick – Uses the instrument’s smallest price increment. Ideal for tick-based markets such as Futures or Forex.
Percent – Defines the stop-loss as a percentage of entry price. Commonly used in Crypto trading.
ATR – Uses the Average True Range value to determine stop-loss distance. Perfect for adapting to changing market volatility.
Supertrend – The stop-loss level is set at the Supertrend line value at the time of entry.
🔁 Trailing Stop-Loss & Reverse Signals
Trailing SL: If enabled, the chosen stop-loss method will trail the price dynamically from the moment the position opens.
Close with Reverse Signals: When activated, the current position closes and reverses on an opposite signal. If disabled, the strategy waits until the current position is closed before opening a new one.
🎯 Take-Profit Options
Tick – Set a fixed take-profit level based on tick distance.
Percent – Set take-profit based on a percentage change from entry.
Ratio – Sets take-profit based on the entry-to-stop-loss distance × ratio value.
Each take-profit method allows you to define the percentage of position to close at that level.
⚖️ Breakeven Option
When Breakeven is enabled, after the first take-profit is triggered, the stop-loss automatically moves to the entry level, protecting your capital.
⚙️ Additional Settings
Position Type: Choose between Long only, Short only, or Both directions.
Session Filter: Trade only during specific time ranges. Activate this option and set your desired session hours (make sure to select your correct timezone).
📈 Visuals
The strategy plots entry, stop-loss, and take-profit levels directly on the chart, allowing you to clearly visualize your trades and manage them effectively.
Feel free to ask any questions or suggest improvements — this strategy is built for flexibility and experimentation!
Cari dalam skrip untuk "stop loss"
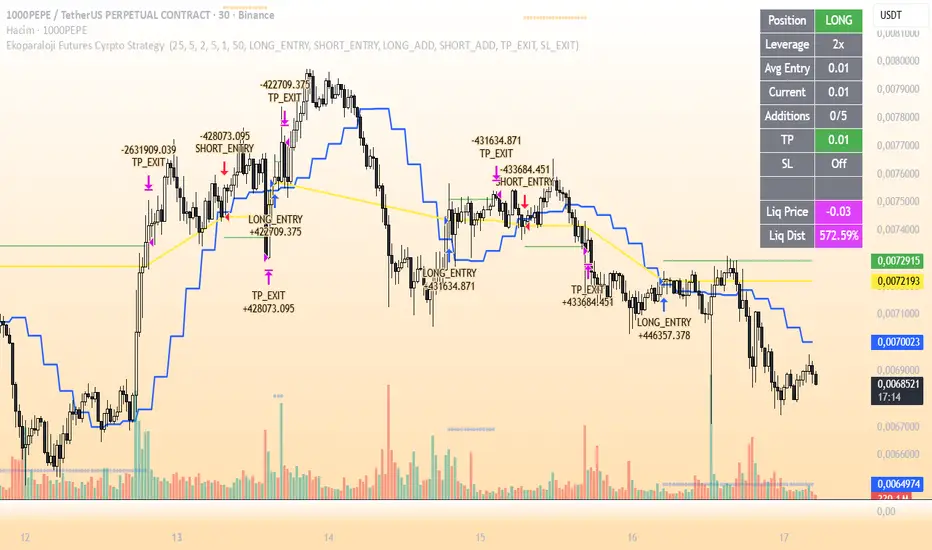
Ekoparaloji Futures Cyrpto Strategy Ekoparaloji Futures Crypto Strategy - Ladder Averaging System
This strategy uses a ladder position entry (pyramiding) approach and average cost reduction principle for crypto futures markets.
Key Features:
Dynamic ladder entry system
Profit-taking mechanism based on average price
Adjustable leverage support (1x-125x)
Long and Short position management
Optional stop-loss protection
Liquidation distance tracking
Advantages:
✓ Optimizes average cost during price fluctuations
✓ User-controlled risk-reward ratio
✓ Adapts to different market conditions
✓ Provides detailed visual feedback
✓ Increases profit potential through pyramiding strategy
Risks:
⚠ High leverage usage increases liquidation risk
⚠ Losses can accumulate during trend continuation
⚠ Pyramiding adds capital requirements
⚠ May produce unexpected results in sideways markets
⚠ Past performance does not guarantee future results
Recommended Usage:
This strategy is optimized for testing particularly on 30-minute and 1-hour timeframes. It may produce different results across various crypto pairs and market conditions.
Important Warning:
This strategy is for educational and research purposes. Extensive testing on demo accounts is strongly recommended before using in live trading. Leveraged trading involves high risk and you can lose all your capital.
📩 Message me to test the strategy and get access.
Happy Trading! 🚀
MTF MACD + Accelerator Oscillator Strategy ※日本語説明は英文の下にあります。
Concept:
This is a multi-timeframe trend-following strategy that combines:
Higher timeframe MACD → determines the major trend direction.
Lower timeframe Accelerator Oscillator (AC) → identifies acceleration in momentum for optimal entry timing.
The strategy enters trades in the direction of the higher timeframe trend when the AC shows a momentum acceleration.
Entry Rules:
Long (Buy):
Higher timeframe MACD line > signal line (uptrend)
AC crosses above zero line on the lower timeframe
Short (Sell):
Higher timeframe MACD line < signal line (downtrend)
AC crosses below zero line on the lower timeframe
Exit Rules:
Take Profit: ATR(14) * 1.5 (configurable)
Stop Loss: ATR(14) * 1.0 (configurable)
Exit on opposite signal or if TP/SL is hit
Plotting:
AC is plotted on the chart (green for positive, red for negative)
Buy/Sell signals are marked with small triangles below/above bars
Customization:
Timeframe, MACD parameters, ATR multipliers can be adjusted in the input settings.
Works for scalping, day trading, or swing trading on various instruments.
---------------------------------------------------------------------
コンセプト:
この戦略はマルチタイムフレームのトレンドフォロー型で、以下を組み合わせています:
上位足MACD → 大きなトレンド方向を確認
下位足Accelerator Oscillator(AC) → モメンタム加速のタイミングを捉え、最適なエントリーを判断
上位足のトレンド方向に沿って、下位足でACが勢いの加速を示したタイミングでエントリーします。
エントリールール:
ロング(買い):
上位足MACDライン > シグナルライン(上昇トレンド)
下位足ACが0ラインを上抜け
ショート(売り):
上位足MACDライン < シグナルライン(下降トレンド)
下位足ACが0ラインを下抜け
エグジットルール:
利確:ATR(14) * 1.5(設定可能)
損切り:ATR(14) * 1.0(設定可能)
逆シグナル発生時やTP/SL到達時にも決済
チャート表示:
ACはチャート上にプロット(正なら緑、負なら赤)
買い/売りシグナルはバーの下/上に小さな三角で表示
カスタマイズ:
時間足、MACDパラメータ、ATR倍率は入力設定で変更可能
スキャルピング、デイトレード、スイングトレードなど幅広く利用可能

高频策略优化版-空头Open Condition Reversal: Change the condition of the TEMA fast line above the slow line to the condition of the fast line below the slow line RSI condition from " buy above the threshold " to " short below the threshold ", and adjust the default threshold from 30 to 70 (more suitable for shorting overbought area) moving average direction judgment from up to down stop-loss direction adjustment: Short stop-loss Settings above the entry price (entry price * (1 + i _ sl) ) Short stop-loss set below the entry price (entry price * (1-tp) Tracking stop-loss level adjusted to below the entry price MACD logic adjustment: Preferred use of the bearish pattern as a short signal bullish pattern for closing risk management: Maintained a dynamic stop-loss mechanism, adjusted to protect the market from the bottom of the visual stop-loss strategy: The visual marking of the ACD energy column is convenient for monitoring signals to be fully tested before use, especially for adjusting RSI thresholds and stop-loss parameters to suit the characteristics of specific trading varieties.

G. Santostasi Bitcoin Power Law StrategyG. Santostasi Bitcoin Power Law Strategy
Overview
The "G. Santostasi Bitcoin Power Law Strategy" is a TradingView strategy script built upon the foundational Bitcoin Power Law Theory by physicist Giovanni Santostasi.
Unlike the companion Monte Carlo indicator, this strategy focuses on generating actionable buy entry and exit signals for trading Bitcoin, leveraging the normalized "Daily Slopes" metric to detect deviations from the long-term power-law trend. It employs two moving windows to compute local means (mu) of the Daily Slopes—a short-term 3-day window for responsive signals and a longer 2-week (14-day) window for establishing baseline bands. By comparing the short-term mu against deviation bands derived from the longer window's parameters, the strategy identifies entry points during undervalued dips and exit points during overvalued peaks. This approach capitalizes on Bitcoin's scale-invariant behavior, where price follows a power law
P(t)= c t^n, with n~5.9.
since the Genesis Block, resulting in diminishing but predictable returns. Backtested over Bitcoin's full history, the strategy boasts a 77% winning rate and a profit factor of 3.2, making it a robust tool for trend-following with mean-reversion elements. It emphasizes Bitcoin's long-term stability while navigating short-term oscillations, treating cycles as temporary deviations from the core power-law "DNA.
"Core Concept: Daily Slopes
The strategy inherits the Daily Slopes metric from the power-law framework, which normalizes daily logarithmic returns to reveal a stable local slope that oscillates around the global value of ~5.9.Definition and Calculation:
Daily log returns: log(P2/P1)\, where P2 and P1 are consecutive closing prices.
Normalization: Divide by log((t+1)/t), where ( t ) is days since the Genesis Block, yielding:
Daily Slope=log(P2/P1)log((t+1)/t).
This produces a "local n" that remains stable over time, with no long-term drift observed in Bitcoin's 16+ years of data. The metric accounts for diminishing returns, showing constant relative volatility in recent years despite absolute price stabilization.
Distribution and Parameters:
Daily Slopes are fitted to a t-location scale distribution over moving windows, estimating:μ (mu): The location/mean, stable around 5.9 globally.
σ (sigma): Scale/volatility measure.
ν (nu): Degrees of freedom for tail heaviness.
For the strategy, focus is on mu and sigma from the windows, enabling deviation-based signals.
Strategy Logic: Dual Moving Window Mus and Deviation Bands
The strategy computes two mus via rolling fits to the t-distribution:
Short Window mu (3 days): A fast-moving average of Daily Slopes, sensitive to immediate price action for timely signals.
Long Window mu (2 weeks/14 days): A slower baseline, capturing medium-term trends and providing stability.
Deviation bands are derived from the long window's mu and sigma:
Upper Band: Long mu + Long sigma
Lower Band: Long mu - Long sigma
These bands represent 1-standard-deviation ranges around the longer-term mean, highlighting overbought and oversold conditions relative to the power-law trend. The short mu acts as a "signal line," crossing the bands to trigger trades.
Plotting:
Short mu: Responsive line for crossovers.
Long mu: Central baseline.
Bands: Upper (+σ) and lower (-σ) lines from the long window.
Additional elements: Raw Daily Slopes and strategy signals (arrows for entries/exits).
Entry and Exit Rules:
The strategy generates long-only signals (buy/sell) based on crossovers, assuming a single-position approach without leverage or shorting:
Buy Entry: Triggered when the short-window mu crosses above the lower band (long mu - long sigma). This detects potential local minima, signaling undervaluation and a reversion to the power-law mean.
Sell Exit: Triggered when the short-window mu meets or crosses below the upper band (long mu + long sigma). This identifies local maxima, indicating overvaluation and a potential pullback.
Trade Management:
No stop-loss or take-profit hardcoded; users can add via TradingView settings.
Positions close on exit signals, with re-entry on the next valid buy.
Filters for false signals: Optional confirmation from global slope (e.g., only trade if long mu > 5.0) to align with bullish regimes.
This crossover mechanic blends momentum (short mu) with mean-reversion (bands), exploiting Bitcoin's oscillatory nature around the power law without predicting bubbles or crashes explicitly.
Performance Metrics:
Backtested on BTCUSD daily data from the Genesis Block to present (assuming continuous updates):Winning Rate: 77% – A high hit rate due to the strategy's focus on statistically stable deviations.
Profit Factor: 3.2 – Gross profits are 3.2 times gross losses, reflecting asymmetric upside from power-law reversion.
Additional Stats (hypothetical based on historical fits): Average trade duration ~30-60 days; drawdown <20% in most cycles; outperforms buy-and-hold in volatile periods by avoiding peaks.
Caveats: Past performance is not indicative of future results. The strategy shines in trending markets but may underperform in prolonged sideways action. Transaction costs (e.g., fees, slippage) not included in base metrics.
Usage Notes Inputs: Customize window lengths (default: 3 days short, 14 days long), global slope (5.9), and signal thresholds. Enable alerts for entries/exits.
Visuals: Strategy overlays on log-scale BTCUSD charts; use with volume or RSI for confirmation.
Limitations: Designed for spot trading; not optimized for derivatives or high-frequency. Assumes power-law persistence—major regime shifts (e.g., adoption plateaus) could impact efficacy.
Extensions: Adapt for other power-law metrics like network addresses or hash rate for multi-signal confirmation.
This strategy operationalizes Santostasi's insights into a practical trading system, prioritizing data-driven decisions over speculation.

KCandle Strategy 1.0# KCandle Strategy 1.0 - Trading Strategy Description
## Overview
The **KCandle Strategy** is an advanced Pine Script trading system based on bullish and bearish engulfing candlestick patterns, enhanced with sophisticated risk management and position optimization features.
## Core Logic
### Entry Signal Generation
- **Pattern Recognition**: Detects bullish and bearish engulfing candlestick formations
- **EMA Filter**: Uses a customizable EMA (default 25) to filter trades in the direction of the trend
- **Entry Levels**:
- **Long entries** at 25% of the candlestick range from the low
- **Short entries** at 75% of the candlestick range from the low
- **Signal Validation**: Orange candlesticks indicate valid setup conditions
### Risk Management System
#### 1. **Stop Loss & Take Profit**
- Configurable stop loss in pips
- Risk-reward ratio setting (default 2:1)
- Visual representation with colored lines and labels
#### 2. **Break-Even Management**
- Automatically moves stop loss to break-even when specified R:R is reached
- Customizable break-even offset for added protection
- Prevents losing trades after reaching profitability
#### 3. **Trailing Stop System**
- **Activation Trigger**: Activates when position reaches specified R:R level
- **Distance Control**: Maintains trailing stop at defined distance from entry
- **Step Management**: Moves stop loss forward in incremental R steps
- **Dynamic Protection**: Locks in profits while allowing for continued upside
### Advanced Features
#### Position Management
- **Pyramiding Support**: Optional multiple position entries with size reduction
- **Order Expiration**: Pending orders automatically cancel after specified bars
- **Position Sizing**: Percentage-based allocation with pyramid level adjustments
#### Visual Interface
- **Real-time Monitoring**: Comprehensive information panel with all strategy metrics
- **Historical Tracking**: Visual representation of past trades and levels
- **Color-coded Indicators**: Different colors for break-even, trailing, and standard stops
- **Debug Options**: Optional labels for troubleshooting and optimization
## Key Parameters
### Basic Settings
- **EMA Length**: Trend filter period
- **Stop Loss**: Risk per trade in pips
- **Risk/Reward**: Target profit ratio
- **Order Validity**: Duration of pending orders
### Risk Management
- **Break-Even R:R**: Profit level to trigger break-even
- **Trailing Activation**: R:R level to start trailing
- **Trailing Distance**: Stop distance from entry when trailing
- **Trailing Step**: Increment for stop loss advancement
## Strategy Benefits
1. **Objective Entry Signals**: Based on proven candlestick patterns
2. **Trend Alignment**: EMA filter ensures trades align with market direction
3. **Robust Risk Control**: Multiple layers of protection (SL, BE, Trailing)
4. **Profit Optimization**: Trailing stops maximize winning trade potential
5. **Flexibility**: Extensive customization options for different market conditions
6. **Visual Clarity**: Complete visual feedback for trade management
## Ideal Use Cases
- **Swing Trading**: Medium-term positions with trend-following approach
- **Breakout Trading**: Capturing momentum from engulfing patterns
- **Risk-Conscious Trading**: Suitable for traders prioritizing capital preservation
- **Multi-Timeframe**: Adaptable to various timeframes and instruments
---
*The KCandle Strategy combines traditional technical analysis with modern risk management techniques, providing traders with a comprehensive tool for systematic market participation.*

维加斯双通道策略Vegas Channel Comprehensive Strategy Description
Strategy Overview
A comprehensive trading strategy based on the Vegas Dual Channel indicator, supporting dynamic position sizing and fund management. The strategy employs a multi-signal fusion mechanism including classic price crossover signals, breakout signals, and retest signals, combined with trend filtering, RSI+MACD filtering, and volume filtering to ensure signal reliability.
Core Features
Dynamic Position Sizing: Continue adding positions on same-direction signals, close all positions on opposite signals
Smart Take Profit/Stop Loss: ATR-based dynamic TP/SL, updated with each new signal
Fund Management: Supports dynamic total amount management for compound growth
Time Filtering: Configurable trading time ranges
Risk Control: Maximum order limit to prevent over-leveraging
Leverage Usage Instructions
Important: This strategy does not use TradingView's margin functionality
Setup Method
Total Amount = Actual Funds × Leverage Multiplier
Example: Have 100U actual funds, want to use 10x leverage → Set total amount to 100 × 10 = 1000U
Trading Amount Calculation
Each trade percentage is calculated based on leveraged amount
Example: Set 10% → Actually trade 100U margin × 10x leverage = 1000U trading amount
Maximum Orders Configuration
Must be used in conjunction with leveraged amount
Example: 1000U total amount, 10% per trade, maximum 10 orders = maximum use of 1000U
Note: Do not exceed 100% of total amount to avoid over-leveraging
Parameter Configuration Recommendations
Leverage Configuration Examples
Actual funds 100U, 5x leverage, total amount setting 500U, 10% per trade, 50U per trade, recommended maximum orders 10
Actual funds 100U, 10x leverage, total amount setting 1000U, 10% per trade, 100U per trade, recommended maximum orders 10
Actual funds 100U, 20x leverage, total amount setting 2000U, 5% per trade, 100U per trade, recommended maximum orders 20
Risk Control
Conservative: 5-10x leverage, 10% per trade, maximum 5-8 orders
Aggressive: 10-20x leverage, 5-10% per trade, maximum 10-15 orders
Extreme: 20x+ leverage, 2-5% per trade, maximum 20+ orders
Strategy Advantages
Signal Reliability: Multiple filtering mechanisms reduce false signals
Capital Efficiency: Dynamic fund management for compound growth
Risk Controllable: Maximum order limits prevent liquidation
Flexible Configuration: Supports various leverage and fund allocation schemes
Time Control: Configurable trading hours to avoid high-risk periods
Usage Notes
Ensure total amount is set correctly (actual funds × leverage multiplier)
Maximum orders should not exceed the range allowed by total funds
Recommend starting with conservative configuration and gradually adjusting parameters
Regularly monitor strategy performance and adjust parameters timely
维加斯通道综合策略说明
策略概述
基于维加斯双通道指标的综合交易策略,支持动态加仓和资金管理。策略采用多信号融合机制,包括经典价穿信号、突破信号和回踩信号,结合趋势过滤、RSI+MACD过滤和成交量过滤,确保信号的可靠性。
核心功能
动态加仓:同向信号继续加仓,反向信号全部平仓
智能止盈止损:基于ATR的动态止盈止损,每次新信号更新
资金管理:支持动态总金额管理,实现复利增长
时间过滤:可设置交易时间范围
风险控制:最大订单数限制,防止过度加仓
杠杆使用说明
重要:本策略不使用TradingView的保证金功能
设置方法
总资金 = 实际资金 × 杠杆倍数
示例:实际有100U,想使用10倍杠杆 → 总资金设置为 100 × 10 = 1000U
交易金额计算
每笔交易百分比基于杠杆后的金额计算
示例:设置10% → 实际交易 100U保证金 × 10倍杠杆 = 1000U交易金额
最大订单数配置
必须配合杠杆后的金额使用
示例:1000U总资金,10%单笔,最大10单 = 最多使用1000U
注意:不要超过总资金的100%,避免过度杠杆
参数配置建议
杠杆配置示例
实际资金100U,5倍杠杆,总资金设置500U,单笔百分比10%,单笔金额50U,建议最大订单数10单
实际资金100U,10倍杠杆,总资金设置1000U,单笔百分比10%,单笔金额100U,建议最大订单数10单
实际资金100U,20倍杠杆,总资金设置2000U,单笔百分比5%,单笔金额100U,建议最大订单数20单
风险控制
保守型:5-10倍杠杆,10%单笔,最大5-8单
激进型:10-20倍杠杆,5-10%单笔,最大10-15单
极限型:20倍以上杠杆,2-5%单笔,最大20单以上
策略优势
信号可靠性:多重过滤机制,减少假信号
资金效率:动态资金管理,实现复利增长
风险可控:最大订单数限制,防止爆仓
灵活配置:支持多种杠杆和资金配置方案
时间控制:可设置交易时间,避开高风险时段
使用注意事项
确保总资金设置正确(实际资金×杠杆倍数)
最大订单数不要超过总资金允许的范围
建议从保守配置开始,逐步调整参数
定期监控策略表现,及时调整参数

J12Matic Builder by galgoomA flexible Renko/tick strategy that lets you choose between two entry engines (Multi-Source 3-way or QBand+Moneyball), with a unified trailing/TP exit engine, NY-time trading windows with auto-flatten, daily profit/loss and trade-count limits (HALT mode), and clean webhook routing using {{strategy.order.alert_message}}.
Highlights
Two entry engines
Multi-Source (3): up to three long/short sources with Single / Dual / Triple logic and optional lookback.
QBand + Moneyball: Gate → Trigger workflow with timing windows, OR/AND trigger modes, per-window caps, optional same-bar fire.
Unified exit engine: Trailing by Bricks or Ticks, plus optional static TP/SL.
Session control (NY time): Evening / Overnight / NY Session windows; auto-flatten at end of any enabled window.
Day controls: Profit/Loss (USD) and Trade-count limits. When hit, strategy HALTS new entries, shows an on-chart label/background.
Alert routing designed for webhooks: Every order sets alert_message= so you can run alerts with:
Condition: this strategy
Notify on: Order fills only
Message: {{strategy.order.alert_message}}
Default JSONs or Custom payloads: If a Custom field is blank, a sensible default JSON is sent. Fill a field to override.
How to set up alerts (the 15-second version)
Create a TradingView alert with this strategy as Condition.
Notify on: Order fills only.
Message: {{strategy.order.alert_message}} (exactly).
If you want your own payloads, paste them into Inputs → 08) Custom Alert Payloads.
Leave blank → the strategy sends a default JSON.
Fill in → your text is sent as-is.
Note: Anything you type into the alert dialog’s Message box is ignored except the {{strategy.order.alert_message}} token, which forwards the payload supplied by the strategy at order time.
Publishing notes / best practices
Renko users: Make sure “Renko Brick Size” in Inputs matches your chart’s brick size exactly.
Ticks vs Bricks: Exit distances switch instantly when you toggle Exit Units.
Same-bar flips: If enabled, a new opposite signal will first close the open trade (with its exit payload), then enter the new side.
HALT mode: When day profit/loss limit or trade-count limit triggers, new entries are blocked for the rest of the session day. You’ll see a label and a soft background tint.
Session end flatten: Auto-closes positions at window ends; these exits use the “End of Session Window Exit” payload.
Bar magnifier: Strategy is configured for on-close execution; you can enable Bar Magnifier in Properties if needed.
Default JSONs (used when a Custom field is empty)
Open: {"event":"open","side":"long|short","symbol":""}
Close: {"event":"close","side":"long|short|flat","reason":"tp|sl|flip|session|limit_profit|limit_loss","symbol":""}
You can paste any text/JSON into the Custom fields; it will be forwarded as-is when that event occurs.
Input sections — user guide
01) Entries & Signals
Entry Logic: Choose Multi-Source (3) or QBand + Moneyball (pick one).
Enable Long/Short Signals: Master on/off switches for entering long/short.
Flip on opposite signal: If enabled, a new opposite signal will close the current position first, then open the other side.
Signal Logic (Multi-Source):
Single: any 1 of the 3 sources > 0
Dual: Source1 AND Source2 > 0
Triple (default): 1 AND 2 AND 3 > 0
Long/Short Signal Sources 1–3: Provide up to three series (often indicators). A positive value (> 0) is treated as a “pulse”.
Use Lookback: Keeps a source “true” for N bars after it pulses (helps catch late triggers).
Long/Short Lookback (bars): How many bars to remember that pulse.
01b) QBands + Moneyball (Gate -> Trigger)
Allow same-bar Gate->Trigger: If ON, a trigger can fire on the same bar as the gate pulse.
Trigger must fire within N bars after Gate: Size of the gate window (in bars).
Max signals per window (0 = unlimited): Cap the number of entries allowed while a gate window is open.
Buy/Sell Source 1 – Gate: Gate pulse sources that open the buy/sell window (often a regime/zone, e.g., QBands bull/bear).
Trigger Pulse Mode (Buy/Sell): How to detect a trigger pulse from the trigger sources (Change / Appear / Rise>0 / Fall<0).
Trigger A/B sources + Extend Bars: Primary/secondary triggers plus optional extension to persist their pulse for N bars.
Trigger Mode: Pick S2 only, S3 only, S2 OR S3, or S2 AND S3. AND mode remembers both pulses inside the window before firing.
02) Exit Units (Trailing/TP)
Exit Units: Choose Bricks (Renko) or Ticks. All distances below switch accordingly.
03) Tick-based Trailing / Stops (active when Exit Units = Ticks)
Initial SL (ticks): Starting stop distance from entry.
Start Trailing After (ticks): Start trailing once price moves this far in your favor.
Trailing Distance (ticks): Offset of the trailing stop from peak/trough once trailing begins.
Take Profit (ticks): Optional static TP distance.
Stop Loss (ticks): Optional static SL distance (overrides trailing if enabled).
04) Brick-based Trailing / Stops (active when Exit Units = Bricks)
Renko Brick Size: Must match your chart’s brick size.
Initial SL / Start Trailing After / Trailing Distance (bricks): Same definitions as tick mode, measured in bricks.
Take Profit / Stop Loss (bricks): Optional static distances.
05) TP / SL Switch
Enable Static Take Profit: If ON, closes the trade at the fixed TP distance.
Enable Static Stop Loss (Overrides Trailing): If ON, trailing is disabled and a fixed SL is used.
06) Trading Windows (NY time)
Use Trading Windows: Master toggle for all windows.
Evening / Overnight / NY Session: Define each session in NY time.
Flatten at End of : Auto-close any open position when a window ends (sends the Session Exit payload).
07) Day Controls & Limits
Enable Profit Limits / Profit Limit (Dollars): When daily net PnL ≥ limit → auto-flatten and HALT.
Enable Loss Limits / Loss Limit (Dollars): When daily net PnL ≤ −limit → auto-flatten and HALT.
Enable Trade Count Limits / Number of Trades Allowed: After N entries, HALT new entries (does not auto-flatten).
On-chart HUD: A label and soft background tint appear when HALTED; a compact status table shows Day PnL, trade count, and mode.
08) Custom Alert Payloads (used as strategy.order.alert_message)
Long/Short Entry: Payload sent on entries (if blank, a default open JSON is sent).
Regular Long/Short Exit: Payload sent on closes from SL/TP/flip (if blank, a default close JSON is sent).
End of Session Window Exit: Payload sent when any enabled window ends and positions are flattened.
Profit/Loss/Trade Limit Close: Payload sent when daily profit/loss limit causes auto-flatten.
Tip: Any tokens you include here are forwarded “as is”. If your downstream expects variables, do the substitution on the receiver side.
Known limitations
No bracket orders from Pine: This strategy doesn’t create OCO/attached brackets on the broker; it simulates exits with strategy logic and forwards your payloads for external automation.
alert_message is per order only: Alerts fire on order events. General status pings aren’t sent unless you wire a separate indicator/alert.
Renko specifics: Backtests on synthetic Renko can differ from live execution. Always forward-test on your instrument and settings.
Quick checklist before you publish
✅ Brick size in Inputs matches your Renko chart
✅ Exit Units set to Bricks or Ticks as you intend
✅ Day limits/Windows toggled as you want
✅ Custom payloads filled (or leave blank to use defaults)
✅ Your alert uses Order fills only + {{strategy.order.alert_message}}

ORB Strategy W/ Confluence This is an Opening Range Breakout (ORB) strategy designed for intraday trading on futures or indices (e.g., MNQ, MES, ES). It identifies the opening range (default 30-minute session from 9:30-10:00 ET) and enters long on a bullish breakout above the range high (ORH) or short below the range low (ORL), with optional daily bias filtering. Targets are set as multiples of the range width (default 50% per level), with partial profit-taking at each hit level. Stop-loss is dynamically set based on a factor of the range width (default 1.0x full range). Optional confluence filters (RSI >70 for long/<30 for short, price above/below 200 EMA, Williams Vix Fix above/below 0.3, or following previous day's close color) can be enabled for entry confirmation. Position sizing is fixed (default 10 contracts), with an option to double after a losing day. Entries are restricted to a user-defined session (default 8:00-17:00), and all positions close at a specified time (default 16:00 ET) to comply with prop firm rules.
Key Parameters to Test:
Instrument/Timeframe: Test on 5-min or 1-min charts for MNQ/MES/ES futures (e.g., tick value 0.5 for MNQ, 1.25 for MES).
Core Settings: OR timeframe=30m, Target %=50, SL Factor=1.0, TP % Remaining=20 (for partial closes). Enable/disable bias ("Daily Bias" for conservative entries).
Filters: Start with all off; test enabling RSI (len=14, level=50, offset=20), EMA (len=200), WVF (period=22, thresh=0.3), and Prev Day Trend individually/combined to see impact on win rate/false signals.
Risk/Sizing: Fixed contracts=10; test double sizing after loss. For risk-based sizing, adjust to use equity risk % (e.g., 1%) and tick value.
Time Rules: Entry session=0800-1700, Exit=16:00; test on NY session data.
Expected Behavior & Test Focus:
Entry Logic: Long signal on close crossover ORH (or ORH + target1 if bearish bias); short on crossunder ORL. Expect 1-2 trades per day, filtered by confluence to reduce whipsaws.
Exits: SL at ORL - factor*range for long (vice versa for short); partial TP at each target level (e.g., 20% of position at T1, reducing thereafter). Full close at 4 PM if open.
Backtest Metrics: Aim for >50% win rate, positive expectancy over 1-2 years (e.g., 2023-2025 NY session data). Monitor drawdown (<10%), profit factor (>1.5), and Sharpe ratio. Test sensitivity to volatility (e.g., high-vol days may hit more targets but risk larger SL). Visuals: OR box, dashed targets/SL lines, signals (▲/▼).
Edge Cases: Test on low-vol days (tight range, fewer breakouts); gaps; after news events. Ensure no over-entries (pyramiding=0) and daily reset works.
This setup emphasizes disciplined intraday breakouts with risk control—backtest on historical data to validate profitability before live use.

Three-Step 9:30 Range Scalping# Three-Step 9:30 Range Scalping Strategy Rules
## Step 1: Mark the Levels (9:30 AM)
- Wait for the **first 5-minute candle** starting at 9:30 AM EST to close
- Mark the **HIGH** and **LOW** of this candle
- Switch to **1-minute chart** for trading
## Step 2: Find Your Entry (Trade for 1 hour only: 9:30-10:30 AM)
### BREAK Entry
- Need: **Fair Value Gap (FVG)** + **ANY** of the 3 FVG candles closes outside the range
- FVG = Gap between candle wicks (3-candle pattern)
### TRAP Entry
- Need: Break outside range → Retest back inside → Close back outside again
### REVERSAL Entry
- Need: Failed break in one direction → Opposite FVG back into the range
## Step 3: Trade Management
### Stop Loss:
- **Break/Trap**: Low/High of first candle that closed outside the range
- **Reversal**: Low/High of first candle in the FVG pattern
### Take Profit:
- **Always 2:1 risk-to-reward ratio**
- If you risk $100, you make $200
## Key Rules:
- ✅ **Body close** outside range (not just wicks)
- ✅ Trade on **1-minute chart** only
- ✅ Only trade **first hour** (9:30-10:30 AM EST)
- ✅ **Fixed 2:1** take profit every time
- ✅ One strategy, stay consistent
**That's it. No complicated indicators, no higher timeframe bias, no guesswork.**

Day Trading Strategy (With Risk Management)This is a day trading strategy based on fast and slow EMA crossovers combined with RSI filtering to enhance trade accuracy. Designed for intraday use, it generates buy signals when the fast EMA crosses above the slow EMA and sell signals when it crosses below, but only if the RSI confirms momentum is favorable to avoid false entries in choppy markets.
The strategy includes built-in risk management with configurable stop-loss and take-profit levels set at 1% by default, helping to limit losses and secure profits quickly within the trading day. Clear buy and sell signals are plotted on the chart, and alerts notify traders in real time when trading opportunities arise.
Ideal for short-term traders, this system provides a disciplined, mechanical approach to capturing intraday trends with momentum confirmation and essential risk controls. It is fully customizable to fit different day trading instruments, timeframes, and risk appetites.

BTC 1m Chop Top/Bottom Reversal (Stable Entries)Strategy Description: BTC 5m Chop Top/Bottom Reversal (Stable Entries)
This strategy is engineered to capture precise reversal points during Bitcoin’s choppy or sideways price action on the 5-minute timeframe. It identifies short-term tops and bottoms using a confluence of volatility bands, momentum indicators, and price structure, optimized for high-probability scalping and intraday reversals.
Core Logic:
Volatility Filter: Uses an EMA with ATR bands to define overextended price zones.
Momentum Divergence: Confirms reversals using RSI and MACD histogram shifts.
Price Action Filter: Requires candle confirmation in the direction of the trade.
Locked Signal Logic: Prevents repaints and disappearing trades by confirming signals only once per bar.
Trade Parameters:
Short Entry: Above upper band + overbought RSI + weakening MACD + bearish candle
Long Entry: Below lower band + oversold RSI + strengthening MACD + bullish candle
Take Profit: ±0.75%
Stop Loss: ±0.4%
This setup is tuned for traders using tight risk control and leverage, where execution precision and minimal drawdown tolerance are critical.

Intraday Momentum StrategyExplanation of the StrategyIndicators:Fast and Slow EMA: A crossover of the 9-period EMA over the 21-period EMA signals a bullish trend (long entry), while a crossunder signals a bearish trend (short entry).
RSI: Ensures entries are not in overbought (RSI > 70) or oversold (RSI < 30) conditions to avoid reversals.
VWAP: Acts as a dynamic support/resistance. Long entries require the price to be above VWAP, and short entries require it to be below.
Trading Session:The strategy only trades during a user-defined session (e.g., 9:30 AM to 3:45 PM, typical for US markets).
All positions are closed at the session end to avoid overnight risk.
Risk Management:Stop Loss: 1% below/above the entry price for long/short positions.
Take Profit: 2% above/below the entry price for long/short positions.
These can be adjusted via inputs for optimization.
Position Sizing:Fixed lot size of 1 for simplicity. Adjust based on your account size during backtesting.

Strategi FVG 09:31 (Pro)FVG 09:31 Strategy (Pro)
In short, this is an automated trading strategy (bot) for TradingView designed to execute buy or sell orders based on a Fair Value Gap (FVG) pattern. The strategy is highly specific, as it only triggers on the 1-minute timeframe and looks for an FVG that forms precisely at 09:32 AM New York time.
Main Purpose of the Strategy
The primary goal of this script is to identify and capitalize on short-term price imbalances, known as Fair Value Gaps (FVGs). It operates during a specific, high-volatility window right after the U.S. stock market opens, often referred to by traders as the "Silver Bullet" session. By automating the detection and execution, it aims to trade these fleeting opportunities with precision.
How the Strategy Works
The strategy follows a clear, step-by-step logical flow on your chart.
1. Time & Timeframe Restriction
1-Minute Timeframe: The strategy is hard-coded to work only on the 1-minute (1m) chart. A warning label will appear on your chart if you apply it to any other timeframe.
Specific Time Window: The core logic activates only between 09:32 and 09:33 AM New York time. It searches for an FVG pattern formed by the three candles from 09:29, 09:30, and 09:31, with the pattern confirmation happening on the close of the 09:31 candle.
2. Fair Value Gap (FVG) Detection
An FVG is a three-candle pattern that signals a price imbalance.
Bullish FVG (Potential Buy): Occurs when the low of the first candle is higher than the high of the third candle. The space between these two prices is the FVG zone.
Bearish FVG (Potential Sell): Occurs when the high of the first candle is lower than the low of the third candle. The space between these two prices is the FVG zone.
If this pattern is detected at the target time, the strategy draws a colored box on the chart to visualize the FVG zone (aqua for bullish, fuchsia for bearish).
3. Entry Logic
The strategy provides two user-selectable methods for entering a trade:
Retracement (Immediate Entry): The strategy will open a position with a market order as soon as the price retraces back into the identified FVG zone.
For a Bullish FVG, a Long (buy) position is opened when the price drops to touch the upper boundary of the FVG.
For a Bearish FVG, a Short (sell) position is opened when the price rises to touch the lower boundary of the FVG.
Limit Order (Pending Entry): The strategy places a pending limit order at the edge of the FVG zone.
For a Bullish FVG, a Buy Limit order is placed at the upper boundary of the FVG.
For a Bearish FVG, a Sell Limit order is placed at the lower boundary of the FVG.
Order Expiration: If the limit order is not filled within a specified number of candles (default is 15), it is automatically canceled to avoid chasing a stale setup.
4. Exit Logic
Once a position is active, the strategy automatically manages the exit by setting a Take Profit (TP) and Stop Loss (SL) level. You can choose between two types:
Ticks (Fixed Points): You define a fixed profit target and loss limit in ticks (the smallest price movement). For example, a 200-tick TP and a 100-tick SL.
Last Swing (Dynamic Levels): The TP and SL are set dynamically based on the most recent swing high or swing low.
For a Long position: Take Profit is set at the last swing high; Stop Loss is at the last swing low.
For a Short position: Take Profit is set at the last swing low; Stop Loss is at the last swing high.
5. Daily Management
At the start of each new trading day, the script performs a reset. All variables, including any FVG data from the previous day, are cleared. This ensures the strategy only acts on fresh signals from the current day and cancels any pending orders from the day before.
Explanation of Settings (Inputs)
Here is what each user-configurable setting does:
Entry Type: Choose your preferred entry method: Retracement or Limit Order.
Order Expiration (Candles): Applies only to the Limit Order type. Sets how many candles an unfilled order will remain active before being canceled.
Stop Loss Type: Choose Ticks for a fixed-distance stop loss or Last Swing for a dynamic level.
Take Profit Type: Choose Ticks for a fixed-distance profit target or Last Swing for a dynamic level.
Pivot Lookback (SL/TP Swing): Defines how many candles the script looks back to identify the most recent swing high/low for the Last Swing SL/TP type.
Contract Size: The quantity or lot size for each trade.
Take Profit (in Ticks): The profit target distance if using the Ticks type.
Stop Loss (in Ticks): The maximum loss distance if using the Ticks type.

Antony.N4A -NQ ORB Quartile Str v6.3Antony.N4A – NQ ORB Quartile Strategy v6.3
A precision-engineered intraday breakout system built for the Nasdaq futures market, combining the Opening Range Breakout (ORB) logic with dynamic standard deviation targets, structural filters, and multi-layer risk management.
🧠 Key Features
Opening Range Breakout (ORB):
Automatically defines a breakout window (default: 09:30–09:45) and triggers entries when price breaks the high or low of that range.
Standard Deviation Profit Targets:
Supports SD0.5, SD1.0, SD1.5, and SD2.0 targets relative to the ORB range.
EMA Filtering (200-period):
Filters trades based on EMA direction and price position to validate breakout direction and avoid false entries.
Range Filtering:
Detects directional bias and volatility trends using smoothed range logic.
Momentum Triggering:
Validates breakout momentum and allows entries when directional momentum is positive and increasing.
⚙️ User Inputs
ORB Settings: Timeframe, session, and timezone customization
Entry Window: Define when trades are allowed to trigger
Day Filters: Enable/disable trading by weekday
SD Targets: Configure exit % and active levels (SD0.5 – SD2.0)
EMA Filter & Sensitivity
Cross Filter (Anti-chop logic)
Range Filter Parameters
Visual Toggles: ORB range, SD levels, EMA clouds
🎯 Trade Management Rules
Entry:
Triggered at the close of a 5-minute candle confirming a breakout of the ORB range.
Stop Loss:
Defined by structural invalidation (quartile boundaries & mid-range buffers).
Take Profit Strategy:
75% closed at SD1.0 level
Remaining 25% trailed to further SD2 target
SL is moved to breakeven after partial exit
Execution Controls:
No pyramiding
No re-entries (cooldown enforced)
🔧 Trading Modes
✅ Safe Mode
EMA Filter: Enabled
EMA Sensitivity: 19
Range Filter: Disabled
Ideal for conservative setups and reduced noise environments
🔥 Aggressive Mode
EMA Filter: Enabled
EMA Sensitivity: 5
Range Filter: Disabled
Suited for high-frequency setups and faster breakouts
📊 Backtest Performance (7-Month Sample)
Safe Mode:
Win Rate: 66%
Total Trades: 29
Net PnL: +21.79R (~$4,357 with R = $200)
Max Red Days: 3
Max Drawdown: -$663
Best Month: +9R, Worst Month: -2R
Aggressive Mode:
Win Rate: 63%
Total Trades: 52
Net PnL: +30R (~$6,080)
Max Red Days: 6
Max Drawdown: -$1,357
Best Month: +12R, Worst Month: -3.2R
👨💻 Developed by Antony.N4A
This tool is crafted for strategic intraday traders, system developers, and backtesters.
For access, customization, or licensing options, contact the developer directly.
Protected script. Redistribution or reuse without permission is prohibited.
ORB 5M + VWAP + Braid Filter + TP 2R o Niveles PreviosORB 5-Minute Breakout Strategy Summary
Strategy Name:
ORB 5M + VWAP + Braid Filter + TP 2R or Previous Levels
Timeframe:
5-minute chart
Trading Window:
9:35 AM to 11:00 AM (New York time)
✅ Entry Conditions:
Opening Range: Defined from 9:30 to 9:35 AM (first 5-minute candle).
Breakout Entry:
Long trade: Price breaks above the opening range high.
Short trade: Price breaks below the opening range low.
Confirmation Filters (All must be met):
Strong candle (green for long, red for short).
VWAP in the direction of the trade.
Braid Filter by Mango2Juice supports the breakout direction (green for long, red for short).
📉 Stop Loss:
Placed at the opposite side of the opening range.
🎯 Take Profit (TP):
+2R (Risk-to-Reward Ratio of 2:1),
or
Closest of the following: previous day’s high/low or premarket levels.
⚙️ Additional Rules:
Only valid signals between 9:35 and 11:00 AM.
Only one trade per breakout direction per day.
Filter out "trap candles" (very small or indecisive candles).
Avoid trading after 11:00 AM.
📊 Performance Goals:
Maintain a high Profit Factor (above 3 ideally).
Focus on tickers with good historical performance under this strategy (e.g., AMZN, PLTR, CVNA).

Cyber Strategy V1Сyber Strategy V1 – Indicator Testing & Strategy Execution Framework
✅ Overview
Cyber Strategy V1 is a closed-source strategy framework engineered to turn any of yours external indicator into a systematic, rule-based trading system. Designed for rigorous testing and live deployment, it combines multi-signal inputs, confirmations and automated execution paths to help traders and developers validate signal quality and manage risk with precision.
✅ Core Functionality
Multi-Source Independent Signal Inputs
Reversal Logic
Take Profit: up to 5 staggered TP levels, specified as percentage
Stop Loss: configurable via fixed percentage or dynamic SL that trails a reverse signals.
✅ Statistical Drawdown Analysis
For all profitable trades, tracks the maximum intratrade drawdown.
Computes percentile levels of profitable trades that hits minimum drawdowns to inform:
Entry buffer zones (e.g. avoid entering during transient noise)
Partial entry scaling prices.
✅ Signal Confirmation
Optional confirmation delays: hold entry until other signal section send a confirmation from another indicator.
✅ Automated Execution Integrations
Cornix Text Alerts: Generates pre-formatted alerts compatible with Cornix for semi-automated or bot trading.
Webhook Support: Emits JSON payloads on order-fill events to any endpoint, enabling full automation through third-party services or custom order-routing systems.
Important Notes
⚠️ THIS STRATEGY DOES NOT INCLUDE INDICATORS. Examples shown on screenshots use third-party tools. NO PROPRIETARY INDICATORS INCLUDED: Cyber Strategy V1 relies entirely on external signal inputs.
⚠️ All backtesting parameters are customizable; thorough backtesting under realistic slippage, fees and spread assumptions is essential before live deployment.

SMPivot Gaussian Trend Strategy [Js.K]This open-source strategy combines a Gaussian-weighted moving average with “Smart Money” swing-pivot breaks (BoS = Break-of-Structure) to capture trend continuations and early reversals. It is intended for educational and research purposes only and must not be interpreted as financial advice.
How the logic works
-------------------
1. Gaussian Moving Average (GMA)
• A custom Gaussian kernel (length = 30 by default) smooths price while preserving turning points.
• A second pass (“Smoothed GMA”) further filters noise; only its direction is used for bias.
2. Swing-Pivot detection
• High/Low pivots are found with a symmetric look-back/forward window (Pivot Length = 20).
• The most recent confirmed pivot creates a dynamic structure level (UpdatedHigh / UpdatedLow).
3. Entry rules
Long
• Price closes above the most recent pivot high **and** above Smoothed GMA.
Short
• Price closes below the most recent pivot low **and** below Smoothed GMA.
4. Exit rules
• Fixed stop-loss and take-profit in percent of current price (user-defined).
• Separate parameters and on/off switches for longs and shorts.
5. Visuals
• GMA (dots) and Smoothed GMA (line).
• Structure break lines plus “BoS PH/PL” labels at the midpoint between pivot and break.
Inputs
------
Gaussian
• Gaussian Length (default 30) – smoothing window.
• Gaussian Scatterplot – toggle GMA dots.
Smart-Money Pivot
• Pivot Length (default 20).
• Bull / Bear colors.
Risk settings
• Long / Short enable.
• Individual SL % and TP % (default 1 % SL, 30 % TP).
• Strategy uses percent-of-equity sizing; initial capital defaults to 10 000 USD.
Adjust these to reflect your own account size, realistic commission and slippage.
Best practice & compliance notes
--------------------------------
• Test on a data sample that yields ≥ 100 trades to obtain statistically relevant results.
• Keep risk per trade below 5–10 % of equity; the default values comply with this guideline.
• Explain any custom settings you publish that differ from the defaults.
• Do **not** remove the code header or licence notice (MPL-2.0).
• Include realistic commission and slippage in your back-test before publishing.
• The script does **not** repaint; orders are processed on bar close.
Usage
-----
1. Add the script to any symbol / timeframe; intraday and swing timeframes both work—adjust lengths accordingly.
2. Configure SL/TP and position size to match your personal risk management.
3. Run “List of trades” and the performance summary to evaluate expectancy; forward-test before live use.
Disclaimer
----------
Trading involves substantial risk. Past performance based on back-testing is not necessarily indicative of future results. The author is **not** responsible for any financial losses arising from the use of this script.

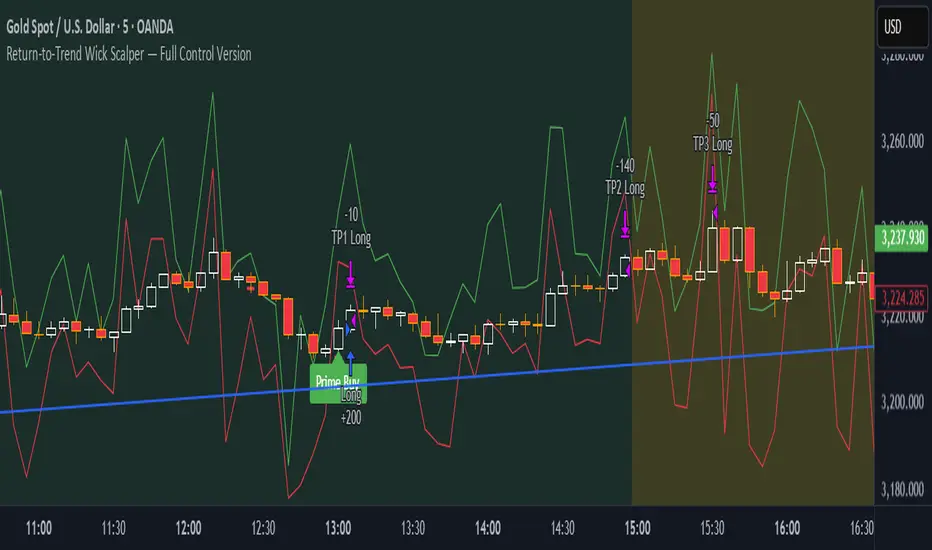
Return-to-Trend Wick Scalper — Full Control VersionReturn-to-Trend Wick Scalper — Modular Scalping Strategy for Gold (XAUUSD) & Indices
This is a precision-engineered scalping strategy designed primarily for high-volatility instruments such as Gold (XAUUSD), NASDAQ, and indices.
The system focuses on counter-trend pullbacks within the dominant daily trend, utilizing wick-based liquidity grabs (commonly referred to as “John Wick” candles) to identify high-probability return-to-trend opportunities.
Key Features:
✅ Dynamic Wick Reversal Detection: Detects reversal setups based on wick dominance and body ratio.
✅ Multiple Take Profit Levels: TP1, TP2, TP3 with individual enable/disable toggles and adjustable exit percentages.
✅ Time-Based Stop-Loss: Optional failsafe to close trades after exceeding a defined number of bars.
✅ VWAP Proximity Filter: Ensures entries happen near volume-weighted average price for precision.
✅ Pullback Depth Control: Filter for significant pullbacks using percentage of daily ATR.
✅ Dynamic Support & Resistance Validation: Confirms setups at key reactive levels.
✅ Volatility Filter: Avoids entries in overly volatile or dead market conditions.
✅ Aggressive Entry Mode: Optional early entry at pullback zones for faster fills.
✅ Paper Trading & Backtest Ready: Fully compatible with TradingView’s Paper Trading simulator.
Usage Notes:
Optimized for 5-minute chart entries.
Use in conjunction with Paper Trading for forward testing before live execution.
Can be connected to live brokers via alert webhooks and external bridges like PineConnector.
Instrument Focus:
Gold (XAUUSD) ✅
NASDAQ ✅
Dow Jones (US30) ✅
Other liquid indices ✅
Risk Note:
Always test thoroughly in Paper Trading before going live.
Optimize TP levels and filters according to market volatility conditions.
Designed for traders who want precision entries, flexibility in scaling out positions, and professional-grade risk control.
ZVGS Reactor🧠 ZVGS Reactor - High-Accuracy Trend Confirmation Strategy (Pine Script v6)
🚀 Overview
ZVGS Reactor is a precision-engineered, multi-layered trading strategy designed for crypto, forex, and equity markets. It blends adaptive trend tracking, directional strength confirmation, and volume validation to generate high-probability entries and exits. Built on a non-repainting foundation, the strategy ensures reliable performance in both backtesting and live trading environments.
🔹 How This Strategy Works (Indicator Fusion)
The ZVGS Reactor combines four core components:
1️⃣ ZLEMA Baseline for Trend Bias
📌 What It Does: Tracks the smoothed price trend and defines directional bias.
✔ Zero Lag Exponential Moving Average (ZLEMA)
Adaptive and responsive to price movement
Price above ZLEMA = bullish bias
Price below ZLEMA = bearish bias
2️⃣ Gradient Trend Filter for Momentum Slope
📌 What It Does: Measures slope strength to confirm directional momentum.
✔ Gradient Filter
Positive slope = bullish push
Negative slope = bearish pressure
3️⃣ Vortex Indicator (RMA Smoothed) for Trend Strength
📌 What It Does: Confirms whether the market is trending strongly in one direction.
✔ Vortex Indicator (VI)
VI+ > VI- = Bullish trend
VI- > VI+ = Bearish trend
Normalized & threshold-filtered for reliable confirmations
4️⃣ Volume Confirmation with Spike or Moving Average Toggle
📌 What It Does: Filters for strong market participation to reduce false breakouts.
✔ Volume Confirmation System
Spike Mode: Volume must exceed 1.5x its recent average
Toggle Option: Switch between spike mode and standard volume > average
Prevents entries in low-volume chop conditions
🎯 Entry & Exit Logic
✔ Long Entry (All Conditions Must Be Met):
Price above ZLEMA
Gradient slope > 0
Vortex confirms bullish strength
Volume passes confirmation filter
✔ Short Entry (All Conditions Must Be Met):
Price below ZLEMA
Gradient slope < 0
Vortex confirms bearish strength
Volume passes confirmation filter
✔ Exits (Fully Automated):
TP1: Close 50% at the first target
TP2: Fully exit at the second target
Stop Loss: Configurable SL included
🔧 Strategy Customization
All parameters are fully adjustable:
✅ ZLEMA length
✅ Volume confirmation mode (Spike or SMA)
✅ TP1/TP2/SL % levels
✅ Vortex length & threshold
✅ Gradient smoothing period
📈 Recommended Use Cases
Markets:
✅ Crypto (BTC, ETH, SOL, etc.)
✅ Forex (EUR/USD, GBP/JPY, etc.)
✅ Stocks & Indices (SPX, NASDAQ, DAX)
Timeframes:
✅ Swing: 1H – 4H – 1D
✅ Intraday: 5M – 15M – 30M
⚙️ Backtest Settings for Realistic Simulation
Initial Capital: $1,000
Commission: 0.05%
Slippage: 1
Date Filter: Built-in start and end time range
📢 TradingView Disclaimer
This script is for educational purposes only and does not constitute financial advice. Trading involves risk. Past performance is not indicative of future results. Always use demo testing before live deployment. Users are fully responsible for their own trading decisions.
🚀 Why Choose ZVGS Reactor?
✅ Zero-lag baseline with adaptive filtering
✅ Trend, strength, and volume confirmation
✅ Volume spike toggle for flexibility
✅ 100% Non-repainting — true signal stability
✅ Clean dashboard with real-time stats
✅ Works across all markets and timeframes
📢 Start Trading Smarter with ZVGS Reactor!
🔗 Use it on TradingView today and optimize your edge. 🔥

EMA 10/55/200 - LONG ONLY MTF (4h with 1D & 1W confirmation)Title: EMA 10/55/200 - Long Only Multi-Timeframe Strategy (4h with 1D & 1W confirmation)
Description:
This strategy is designed for trend-following long entries using a combination of exponential moving averages (EMAs) on the 4-hour chart, confirmed by higher timeframe trends from the daily (1D) and weekly (1W) charts.
🔍 How It Works
🔹 Entry Conditions (4h chart):
EMA 10 crosses above EMA 55 and price is above EMA 55
OR
EMA 55 crosses above EMA 200
OR
EMA 10 crosses above EMA 500
These entries indicate short-term momentum aligning with medium/long-term trend strength.
🔹 Confirmation (multi-timeframe alignment):
Daily (1D): EMA 55 is above EMA 200
Weekly (1W): EMA 55 is above EMA 200
This ensures that we only enter long trades when the higher timeframes support an uptrend, reducing false signals during sideways or bearish markets.
🛑 Exit Conditions
Bearish crossover of EMA 10 below EMA 200 or EMA 500
Stop Loss: 5% below entry price
⚙️ Backtest Settings
Capital allocation per trade: 10% of equity
Commission: 0.1%
Slippage: 2 ticks
These are realistic conditions for crypto, forex, and stocks.
📈 Best Used On
Timeframe: 4h
Instruments: Trending markets like BTC/ETH, FX majors, or growth stocks
Works best in volatile or trending environments
⚠️ Disclaimer
This is a backtest tool and educational resource. Always validate on demo accounts before applying to real capital. Do your own due diligence.

Crypto Strategy SUSDT 10 minThis strategy is designed to trade the **SUSDT** pair on a **10-minute time frame**, using a combination of an Exponential Moving Average (EMA) and percentage-based Stop Loss (SL) and Take Profit (TP) levels.
### How the strategy works:
1. **EMA Calculation**:
- The strategy calculates a 24-period Exponential Moving Average (EMA) based on the closing price.
- This EMA serves as the primary trend indicator.
2. **Entry Conditions**:
- **Long Position**: A long position is entered when the closing price is above the EMA and the opening price is below the EMA. This indicates a potential upward trend.
- **Short Position**: A short position is entered when the closing price is below the EMA and the opening price is above the EMA. This indicates a potential downward trend.
3. **Stop Loss and Take Profit**:
- Both Stop Loss (SL) and Take Profit (TP) are calculated based on the entry price of the position.
- **For Long Positions**:
- Stop Loss is set as a percentage below the entry price.
- Take Profit is set as a percentage above the entry price.
- **For Short Positions**:
- Stop Loss is set as a percentage above the entry price.
- Take Profit is set as a percentage below the entry price.
- The percentage values for SL and TP can be adjusted in the strategy's settings (default: SL = 2%, TP = 4%).
4. **Exit Conditions**:
- The position is closed automatically when either the Stop Loss or Take Profit level is reached.
5. **Visualization**:
- The 24-period EMA is plotted on the chart as a blue line, helping visualize the trend direction.
### Key Features:
- **Pair and Time Frame**: The strategy is optimized for the SUSDT pair on a 10-minute time frame.
- **Customizable Parameters**: Users can adjust the Stop Loss and Take Profit percentages to suit their risk tolerance and trading style.
- **Trend-Following Approach**: The strategy uses the EMA to identify and follow the current market trend.
This strategy is simple yet effective for capturing trends while managing risk through predefined Stop Loss and Take Profit levels.

Rally Base Drop SND Pivots Strategy [LuxAlgo X PineIndicators]This strategy is based on the Rally Base Drop (RBD) SND Pivots indicator developed by LuxAlgo. Full credit for the concept and original indicator goes to LuxAlgo.
The Rally Base Drop SND Pivots Strategy is a non-repainting supply and demand trading system that detects pivot points based on Rally, Base, and Drop (RBD) candles. This strategy automatically identifies key market structure levels, allowing traders to:
Identify pivot-based supply and demand (SND) zones.
Use fixed criteria for trend continuation or reversals.
Filter out market noise by requiring structured price formations.
Enter trades based on breakouts of key SND pivot levels.
How the Rally Base Drop SND Pivots Strategy Works
1. Pivot Point Detection Using RBD Candles
The strategy follows a rigid market structure methodology, where pivots are detected only when:
A Rally (R) consists of multiple consecutive bullish candles.
A Drop (D) consists of multiple consecutive bearish candles.
A Base (B) is identified as a transition between Rallies and Drops, acting as a pivot point.
The pivot level is confirmed when the formation is complete.
Unlike traditional fractal-based pivots, RBD Pivots enforce stricter structural rules, ensuring that each pivot:
Has a well-defined bullish or bearish price movement.
Reduces false signals caused by single-bar fluctuations.
Provides clear supply and demand levels based on structured price movements.
These pivot levels are drawn on the chart using color-coded boxes:
Green zones represent bullish pivot levels (Rally Base formations).
Red zones represent bearish pivot levels (Drop Base formations).
Once a pivot is confirmed, the high or low of the base candle is used as the reference level for future trades.
2. Trade Entry Conditions
The strategy allows traders to select from three trading modes:
Long Only – Only takes long trades when bullish pivot breakouts occur.
Short Only – Only takes short trades when bearish pivot breakouts occur.
Long & Short – Trades in both directions based on pivot breakouts.
Trade entry signals are triggered when price breaks through a confirmed pivot level:
Long Entry:
A bullish pivot level is formed.
Price breaks above the bullish pivot level.
The strategy enters a long position.
Short Entry:
A bearish pivot level is formed.
Price breaks below the bearish pivot level.
The strategy enters a short position.
The strategy includes an optional mode to reverse long and short conditions, allowing traders to experiment with contrarian entries.
3. Exit Conditions Using ATR-Based Risk Management
This strategy uses the Average True Range (ATR) to calculate dynamic stop-loss and take-profit levels:
Stop-Loss (SL): Placed 1 ATR below entry for long trades and 1 ATR above entry for short trades.
Take-Profit (TP): Set using a Risk-Reward Ratio (RR) multiplier (default = 6x ATR).
When a trade is opened:
The entry price is recorded.
ATR is calculated at the time of entry to determine stop-loss and take-profit levels.
Trades exit automatically when either SL or TP is reached.
If reverse conditions mode is enabled, stop-loss and take-profit placements are flipped.
Visualization & Dynamic Support/Resistance Levels
1. Pivot Boxes for Market Structure
Each pivot is marked with a colored box:
Green boxes indicate bullish demand zones.
Red boxes indicate bearish supply zones.
These boxes remain on the chart to act as dynamic support and resistance levels, helping traders identify key price reaction zones.
2. Horizontal Entry, Stop-Loss, and Take-Profit Lines
When a trade is active, the strategy plots:
White line → Entry price.
Red line → Stop-loss level.
Green line → Take-profit level.
Labels display the exact entry, SL, and TP values, updating dynamically as price moves.
Customization Options
This strategy offers multiple adjustable settings to optimize performance for different market conditions:
Trade Mode Selection → Choose between Long Only, Short Only, or Long & Short.
Pivot Length → Defines the number of required Rally & Drop candles for a pivot.
ATR Exit Multiplier → Adjusts stop-loss distance based on ATR.
Risk-Reward Ratio (RR) → Modifies take-profit level relative to risk.
Historical Lookback → Limits how far back pivot zones are displayed.
Color Settings → Customize pivot box colors for bullish and bearish setups.
Considerations & Limitations
Pivot Breakouts Do Not Guarantee Reversals. Some pivot breaks may lead to continuation moves instead of trend reversals.
Not Optimized for Low Volatility Conditions. This strategy works best in trending markets with strong momentum.
ATR-Based Stop-Loss & Take-Profit May Require Optimization. Different assets may require different ATR multipliers and RR settings.
Market Noise May Still Influence Pivots. While this method filters some noise, fake breakouts can still occur.
Conclusion
The Rally Base Drop SND Pivots Strategy is a non-repainting supply and demand system that combines:
Pivot-based market structure analysis (using Rally, Base, and Drop candles).
Breakout-based trade entries at confirmed SND levels.
ATR-based dynamic risk management for stop-loss and take-profit calculation.
This strategy helps traders:
Identify high-probability supply and demand levels.
Trade based on structured market pivots.
Use a systematic approach to price action analysis.
Automatically manage risk with ATR-based exits.
The strict pivot detection rules and built-in breakout validation make this strategy ideal for traders looking to:
Trade based on market structure.
Use defined support & resistance levels.
Reduce noise compared to traditional fractals.
Implement a structured supply & demand trading model.
This strategy is fully customizable, allowing traders to adjust parameters to fit their market and trading style.
Full credit for the original concept and indicator goes to LuxAlgo.
